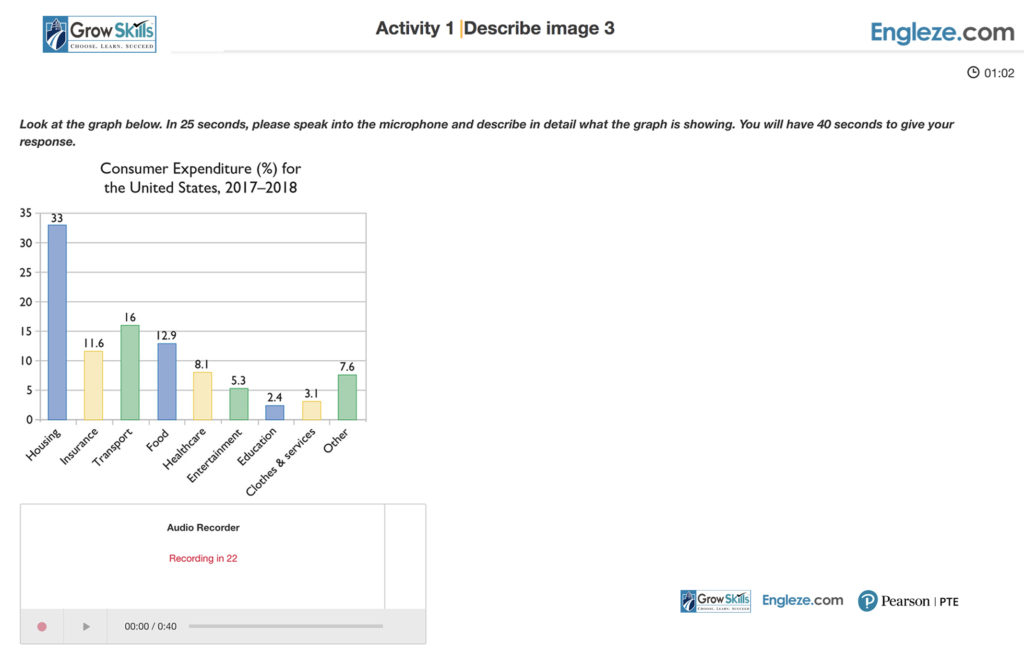
Look at the graph below. In 25 seconds, please speak into the microphone and describe in detail what the graph is showing. You will have 40 seconds to give your response.
Tips & Tricks
Identify the main and significant features and variables of the image.
Model answer – Describe image 3:
The bar graph shows the percentage of consumer expenditure in the US between the years of 2017 and 2018. By far the biggest expense was housing, taking thirty-three percent of an American’s income.
In contrast, the lowest amounts were spent on education, consisting of just 2.4 percent. It is interesting to note that spending on transport accounts for just under half of the housing budget, and this, according to the figures, accounts for more consumer spending than either food or insurance.
Model Answer Audio
for more resources , Follow our Websites and Pages
www.facebook.com/GrowSkills
www.GrowSkills.co.uk
www.GrowSkills.org
www.Engleze.com
www.facebook.com/groups/Engleze


