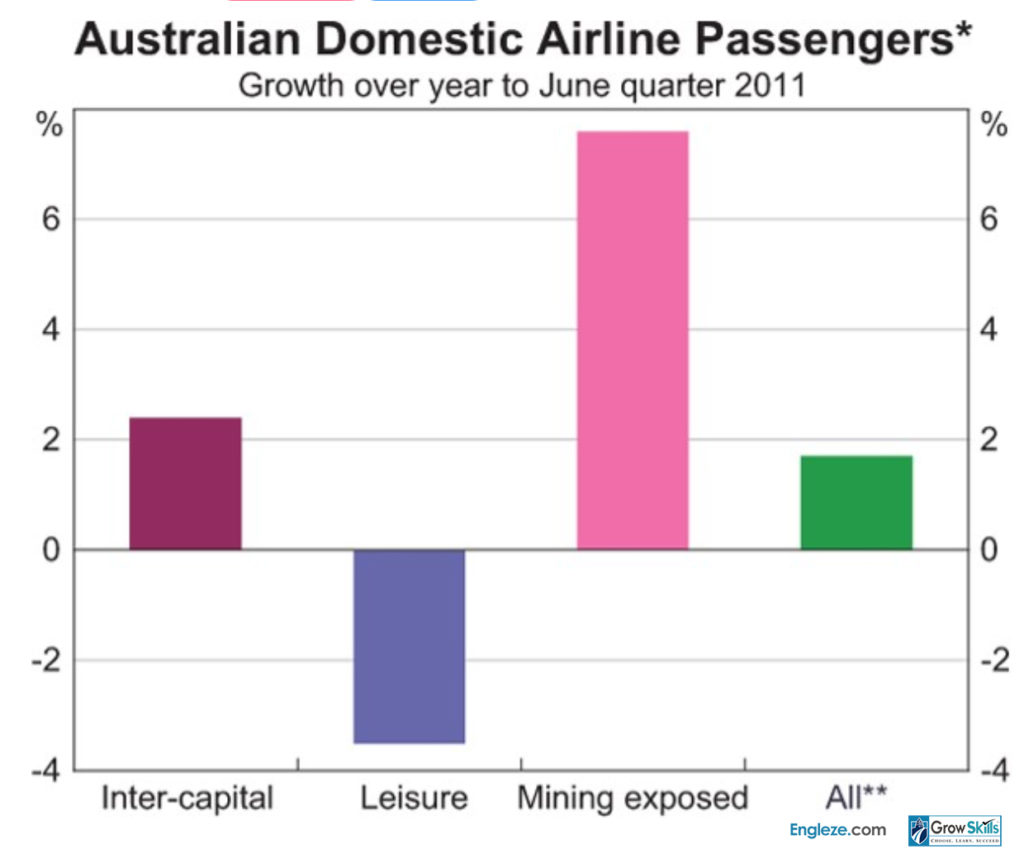
Look at the graph below. In 25 seconds, please speak into the microphone and describe in detail what the graph is showing. You will have 40 seconds to give your response.

Model Answer
” The following graph gives information about domestic airline passengers.
The items include inter-capital, leisure, and all.
According to this graph, in all, the value is around two, and that of inter-capital is higher, which is around two point five.
You can see from this graph that the highest value of is in mining exposed, which is around eight.
You can also see from this graph that the lowest value is in leisure.
In Conclusion, airline passengers have different values. ”
for more resources , Follow our Websites and Pages
www.facebook.com/GrowSkills
www.GrowSkills.co.uk
www.GrowSkills.org
www.Engleze.com
www.facebook.com/groups/Engleze


